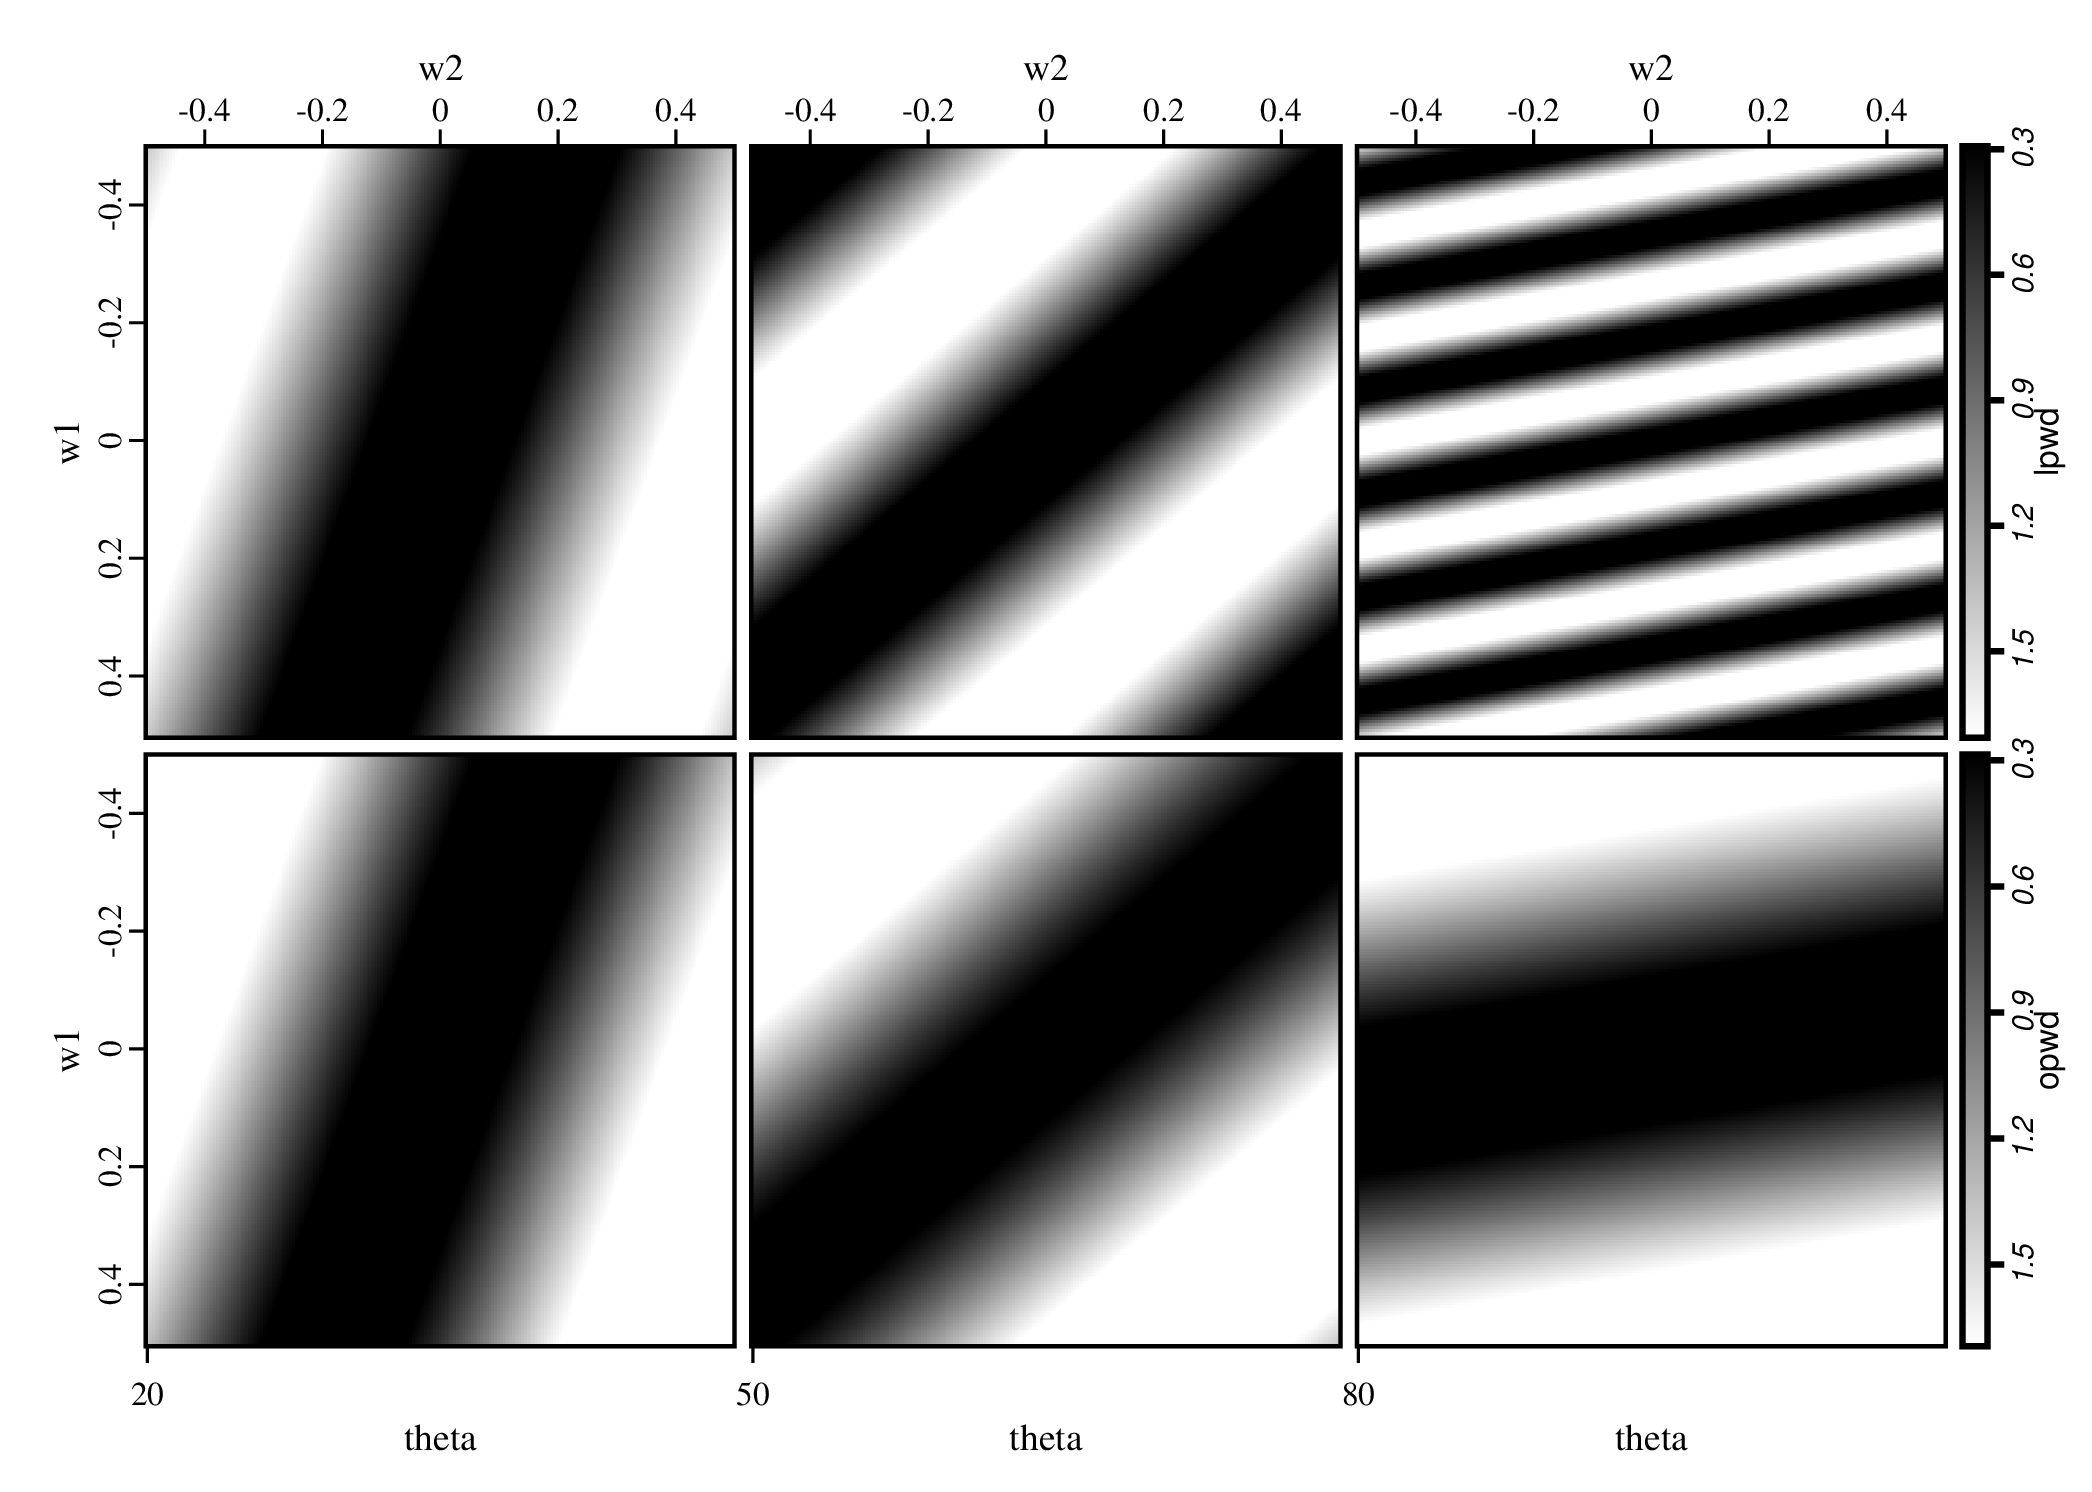
In this example, we use sigclear platform to do the experiment related to Figure 2 in the paper Omnidirectional plane-wave destruction. It compares the frequency responses of LPWD and OPWD operators on three different dipping angles. sigclear platform can handle this experiment simply with only two Processes: one for the frequency analysis of all cases, and another one generate the QC figure.
- frequency responses analysis
- creates a 2D analysis space of 603X201 frequencies;
- split the 2D frequency space into 3 samll ones of dimension 201X201, with each for a dipping angle;
- creates two vectors lpwd and opwd for two PWD operators, and calculates the frequency responses for the two PWD operators.
- generate the QC figure
from experiment import *

Process('freq', None,
	'''
    sgcreate nx=603 vectors=lpwd
      lpwd.type=cfloat lpwd.ns=201 lpwd.ds=0.005 lpwd.s0=-0.5
    | sgfieldmath ig:i="ix/201" index="ix%201" theta:i="20+30*ig"
      w2:f="-0.5+0.005*index" slope:f="2*PI*tan(PI*theta/180)"
      p1:f="2*PI*sin(PI*theta/180)" p2:f="2*PI*cos(PI*theta/180)"
      lpwd="1-exp(-I*2*PI*w2)*exp(-I*slope*lpwd.time)"
      opwd:X="1-exp(-I*lpwd.time*p1)*exp(-I*p2*w2)"
    | sgsort key=group,theta,w2
	''')
Figure('./freq.png',
	'''
	sgplotps left.label=w1
	''')
References:
- Chen, Z., Fomel, S., & Lu, W. (2013). Omnidirectional plane-wave destruction. Geophysics, 78(5), V171-V179.